Contribute
| Technology - Functional Characteristics of Precision Finished Surfaces |
Ramesh Singh
02/16/2004
(This article is sponsored by The Boston Group)
Precision surface finishes are used in a wide variety of applications. From bearing races and rolling elements to parallel slide ways, the frictional characteristics of these surfaces are critical to the performance of the products. Experimental trial and error has shown that certain surfaces outperform others in certain applications, but the specific surface characteristics that make this true are not fully understood.
The role of 3-D surface topographic features on the frictional response for four precision finished surfaces (ground, hard turned, honed, and isotropic), commonly used in the bearing industry is discussed.
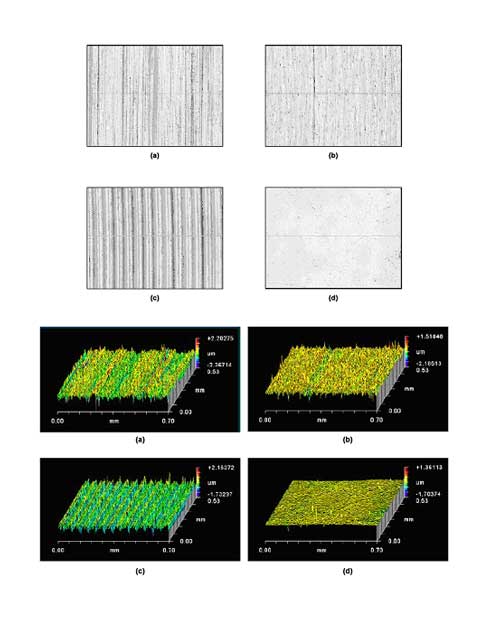
Figure 1 illustrates the surface maps and gray scale images for the four surfaces.
A typical experimental setup for the ball-on-disk configuration is shown by the schematic in Figure 2.
A ball is placed in the spindle and linear motion of the disk is imparted by the movement of machine table.
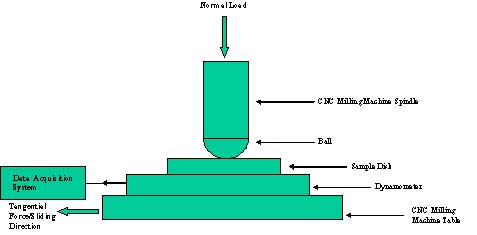
Figure 2.Schematic of the sliding friction setup.
Surface Characterization
A detailed 3-D surface characterization is neccessary. The mathematical functions which come handy in analyzing surfaces are AACF (Areal Auto correlation Function) and APSD (Areal Power Spectral Density). The autocorrelation function for surface profiles is based on the idea that profile readings can be treated as random signals. The AACF is an effective tool to visualize the correlation in different directions. AACF analysis forms a basis for computation of two 3-D surface parameters, namely, Str (texture aspect ratio) and Sal (Fastest autocorrelation decay length). Former is a measure of degree of isotropy and the latter finds application in computation of Sds (density of summits). Density of summits is a very important parameter as it is a very good estimate of the number of asperities per unit area which influence friction. The normalized AACF for surfaces under study are shown in Figure 3.
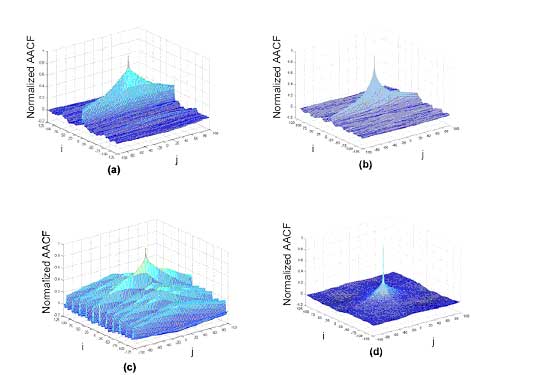 Figure 3.Normalized AACF plots for: (a) GD, (b) HN, (c) HT and (d) IF surfaces.
The other important 3-D parameters is an amplitude parameter, root mean square roughness height, Sq, of the various surfaces which approximates the asperity height.
Discussion
Traditionally it is believed that average roughness determines the frictional response but Ra which is 2-D average roughness alone can't capture the response. Experiments show that the roughness of hard-turned surface is significantly higher than honed surface but it yields lower friction. The explanation for this behavior is offered as the frictional response at a micro level is a result of mechanical interlocking and adhesion which in turn would be a function of actual area of contact. The amplitude parameter Sq, which is the root mean square deviation of asperities from the mean plane, serves as a conservative estimate of the mean asperity height while the density of summits, Sds, gives the number of asperities per unit area. Consequently, a higher asperity height would lead to greater interlocking while a large number of summits would result in a larger real area of contact and hence more adhesion.
Table 1.Coefficient of friction and 3-D parameters
There is also a significant effect of texture direction in ground surface. There is 44.5% increase in the friction coefficient in going from sliding across to sliding along the lay. This is an important observation for designers as to which texture direction to use in a component to maximize its life. The explanation lies in the orientation of asperities (Figure 4).
Surface
Mean coefficient of friction (µ)
Sq(µm)
Sds (/mm2)
GD
0.137
0.424
5806.97
HN
0.124
0.196
3009.71
HT
0.122
0.331
61.11
IF
0.098
0.083
422.53
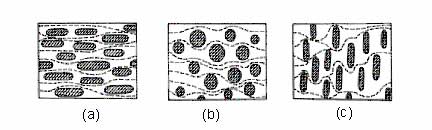
Figure 4. Schematic of lubricant flow in surfaces with: (a) longitudinal, (b) isotropic and (c) transverse texture.
It is evident from the figure that for the longitudinal case (along lay) there is no restriction for lubricant flow and hence no pressure is built up. In the transverse case (across lay), lubricant flow is restricted causing lubricant pressure build up, which supports some of the load and prevents surface-to-surface contact thereby reducing friction. It is obvious from the experimental evidence that understanding how texture affects the friction response would have lasting effect on machines and reduce wear and tear significantly.
(Ramesh Singh is currently a Ph.D student in the Department of Mechanical Engineering at Georgia Institute of Technology, Atlanta, GA. )You may also access this article through our web-site http://www.lokvani.com/